Tap water in NE17, GatesheadSafe to drink.Moderately soft.
Supplied by Northumbrian Water. 1,513 samples, 20 substances, latest on 6 December 2025. Everything is inside the legal limit, and nothing comes close to it.
9.7 / 10
The tank is as full as the score. The specks are the minerals that make water hard.
What to do about it
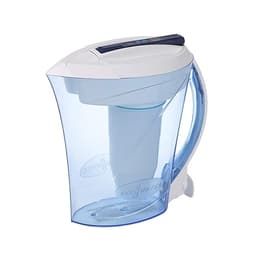
ZeroWater 12-Cup Ready-Pour
£40typical price
Households concerned about PFAS and heavy metals
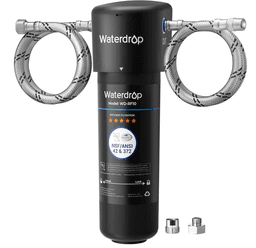
Waterdrop 10UA Under Sink
£70typical price
High-volume under-sink filtration without RO complexity
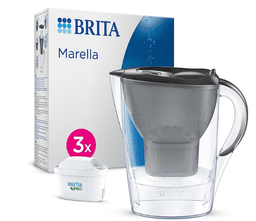
BRITA Marella XL + MAXTRA PRO
£25typical price
Basic chlorine and taste improvement on a budget
We earn a commission if you buy through these links, at no extra cost to you. It never changes which product we put first. How we make money
What's in a glass of NE17 water
Every bubble is a substance the lab measured. The higher it floats, the closer it came to its legal limit, the dashed line at the top.
Aluminium came closest to a limit, at 18% of it. 18 of 18 substances used under a quarter of theirs.
- Aluminium18%
- Turbidity5%
- Bromate5%
- Colour4%
- Antimony3%
- Nitrate3%
- Nickel3%
- Iron3%
- Fluoride3%
- Selenium2%
- Arsenic2%
- Boron2%
- Chromium1%
- Nitrite1%
- Manganese<1%
- Lead<1%
- Cadmium<1%
- Copper<1%
- pH 7.8 pH
- Conductivity 180 µS/cm
All 20 results as a table
| Substance | Result | Legal limit | Share of limit |
|---|---|---|---|
| pH | 7.8 pH | No legal limit | – |
| Colour | 0.81 mg/L Pt/Co | 20 mg/L Pt/Co | 4% |
| Conductivity | 180 µS/cm | No legal limit | – |
| Turbidity | 0.2 NTU | 4 NTU | 5% |
| Iron | 0.0052 mg/L | 0.2 mg/L | 3% |
| Manganese | 0.00033 mg/L | 0.05 mg/L | <1% |
| Aluminium | 0.037 mg/L | 0.2 mg/L | 18% |
| Cadmium | 0.000018 mg/L | 0.005 mg/L | <1% |
| Arsenic | 0.00016 mg/L | 0.01 mg/L | 2% |
| Copper | 0.0014 mg/L | 2 mg/L | <1% |
| Fluoride | 0.038 mg/L | 1.5 mg/L | 3% |
| Nickel | 0.00054 mg/L | 0.02 mg/L | 3% |
| Boron | 0.016 mg/L | 1 mg/L | 2% |
| Bromate | 0.0005 mg/L | 0.01 mg/L | 5% |
| Selenium | 0.00083 mg/L | 0.04 mg/L | 2% |
| Lead | 0.000065 mg/L | 0.01 mg/L | <1% |
| Chromium | 0.00067 mg/L | 0.05 mg/L | 1% |
| Nitrite | 0.0061 mg/L | 0.5 mg/L | 1% |
| Nitrate | 1.5 mg/L | 50 mg/L | 3% |
| Antimony | 0.00016 mg/L | 0.005 mg/L | 3% |
90mg of limescale minerals in every litre
Soft water. Kind to kettles, boilers and skin
You will not need a softener here, and you will use less soap and detergent than most of England.
Your river is the Derwent from Burnhope Burn to River Tyne, rated moderate
The Environment Agency rated the Derwent from Burnhope Burn to River Tyne as moderate for ecological health in its 2025 assessment, meaning the river is noticeably changed by pollution or engineering. It fails the chemical test, as every river, estuary and stretch of coast in England does, because of long-lasting pollutants such as mercury, PFOS (a forever chemical) and old flame retardants.
None of this is a test of your tap water. Environment Agency record · River health across England
43
forever-chemical detections in nearby rivers and groundwater
At 2 sites. The highest was PFBA at 0.0024 µg/L, at Derwent at Clockburn Drift, 7.4 km away, in July 2024. These are river and borehole samples, not tests of your tap water.
Every PFAS sample around Newcastle · Which filters remove PFAS · PFAS explained
NE17 in short
Tap water in NE17 (Gateshead) is supplied by Northumbrian Water in the Gateshead Central zone and scores 9.7 out of 10, against an England and Wales average of 9.0. None of the 20 tested substances came close to a limit. The latest sample is from 6 December 2025.
- 4th cleanest of 9 areas tested in GatesheadSquarely mid-table for Gateshead, between NE10 on 9.7 and NE9 on 9.4.
- 0.7 points above the national average of 9Cleaner than the typical tested district in the UK. Compare every area
- PFAS found at 2 monitoring sites within 10 kmThose are river and groundwater samples, not tap water. The highest was PFBA about 7.4 km away. What was measured
Questions about NE17 water
Is NE17 tap water safe to drink?
Based on the latest tests, NE17 (Gateshead) water scores 9.7/10, which is safe. 0 of 20 tested contaminants exceeded recommended levels. Water is supplied by Northumbrian Water.
What contaminants are in NE17 water?
We tested 20 contaminants in NE17 water. None exceeded recommended safe levels. PFAS (forever chemicals) were also measured in rivers and groundwater within 10 km, though not in the tap-water tests themselves.
Who supplies water in NE17?
NE17 (Gateshead) is supplied by Northumbrian Water. You can view their full profile and compliance data on our supplier page.
Is NE17 water hard or soft?
Water in NE17 (Gateshead) has a hardness of 90 mg/L CaCO3, which is classified as moderately soft. This is a moderate hardness level.
Should I use a water filter in NE17?
NE17 water scored 9.7/10 with no contaminants above recommended levels. A filter is optional but can improve taste, especially if you notice a chlorine flavour. See our filter recommendations for your area.
Are there PFAS forever chemicals in NE17 water?
The tap-water tests we hold for NE17 do not include a PFAS result. Environment Agency monitoring found PFAS in 43 river and groundwater samples from 2 sites within 10 km of NE17, the highest being PFBA at 0.0024 µg/L about 7.4 km away. These are environmental samples, not tests of tap water. The UK currently has no legal limit for PFAS in drinking water; the Drinking Water Inspectorate uses a 0.1 µg/L guideline for individual compounds. Reverse osmosis filters can reduce PFAS levels.
How clean is the river near NE17?
The Environment Agency rated the Derwent from Burnhope Burn to River Tyne as moderate for ecological health in its 2025 assessment, meaning the river is noticeably changed by pollution or engineering. It fails the chemical test, as every river, estuary and stretch of coast in England does, because of long-lasting pollutants such as mercury, PFOS (a forever chemical) and old flame retardants. This is a rating of the river, not of tap water in NE17, which is treated before it reaches homes.
Keep reading
- Best Filter for PFAS RemovalThe filters with independent certification to remove forever chemicals
- PFAS Forever ChemicalsWhat PFAS are and how to reduce your exposure at home
- Is UK Tap Water Safe?Everything you need to know about tap water safety in the UK
- Best Water Filters UKEvery filter type compared on what it actually removes
PFAS explainedHow to test your waterBest water filtersFilter shower headsWater testing kitsUK water rankingsWater hardness checkerWater hardness map
River and groundwater readings near NE17
Environment Agency samples from rivers, groundwater and reservoirs nearby. Not your tap water. For scale they are shown against drinking water limits; rivers are judged against much stricter environmental standards, and on those every river in England fails for chemicals.
Get alerts for your area
We'll email you when water quality data changes for NE17.